Post written by Anna Willoughby:
Generously supported by WiMLDS, I attended the Plotly in R Workshop at PlotCon, November 18-19, 2017. Carson Sievert, the author of the plotly R package and fresh from completing his statistics PhD from Iowa State University, led the two day master-class. The room was mostly filled by with enterprise professionals from insurance, tech, or energy companies. My environmental research angle added to the diverse mix, emphasizing the true utility and flexibility of Plotly across a broad range of topics. Really, if you are using data at all, for personal exploration or an end-user, I highly suggest the plotly R package to beautifully and accurately communicate your data through interactive graphs.
The workshop was packed with tutorials, examples, and a roadmap to navigating the plotly-verse. We used Docker to make sure everyone was linked up with the materials as well as the same environment. What is remarkable about using R packages, is that most are hosted publicly and have ongoing attention from their authors and users. The plotly package is hosted by ROpenSci, a non-profit initiative dedicated to making data retrievable and software reusable. ROpenSci offers a ton to anyone seeking out advice and community when building or using R software; for more details check them out here. Carson advised if there is ever a bug or function in plotly not performing fully, then first you should download the developmental version (run `devtools::install_github(“ropensci/plotly”)`. While this may be a bit less slick, your issue may have already been resolved in this updated version. You can also check the very active Issues tab on the plotly repo to see if your question has already come up. The R community is active here, with 250 open issues and 640 closed as of November 2017. While the java version of Plotly has many developers, the R package is pretty much exclusively managed by Carson.
plotly is enormously flexible, with the ability to turn virtually all static graphs into interactive ones. In order to not dump a full 16 hours of information, I’ll highlight the particularly helpful integration of plotly with the ggplot2 and crosstalk packages. Certainly once you become more comfortable with plotly you should check out other extensions and using animations, shiny, and mapping. In general, if you are ever need a guide, use the plotly::schema function to see the different plot options like plot type, color, and customizations. Because plotly works in conjunction with ggplot2, which supports X packages itself, simply by using the `ggplotly()` function. I was especially thrilled to use ggnetwork + plotly to make social networks with hover-over capabilities. Further, you can link up different plots of the same data by using the crosstalk::subplot function. I think this really translates the data visualization into an explorable story.
The best resources from this workshop are all online and available. Carson shares his workshop materials through a public github repository (yay open science!), along with previous presentations. You can see slides, tutorials, and a variety of shiny apps. Lastly, for a detailed dive into all things plotly, check out the ebook: https://plotly-book.cpsievert.me/ with detailed descriptions and visuals to answer all your questions. plotly does the heavy lifting for you, allowing us users to focus in on the fun stuff: how to make a plot visually appealing and useful for our audience.
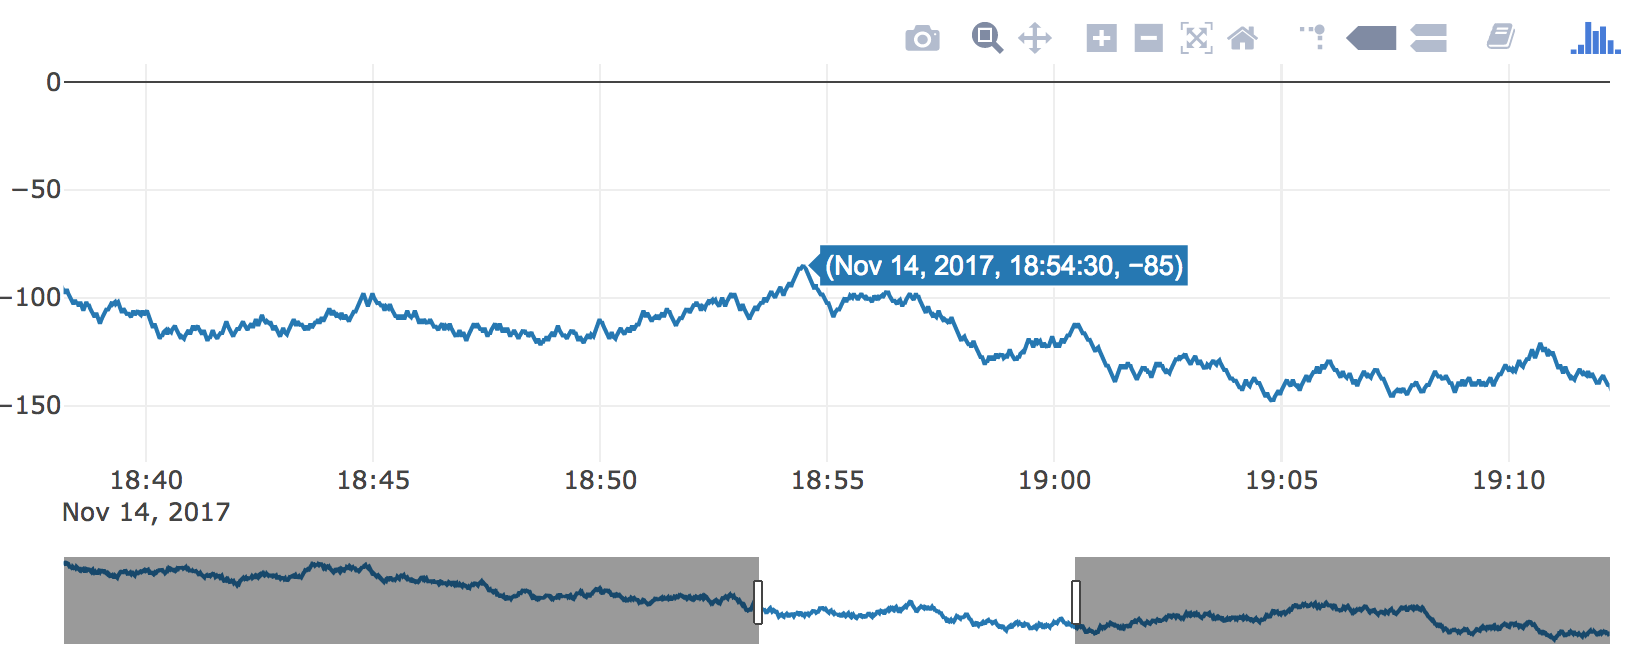
*All images retrieved from github.com/cpsievart